
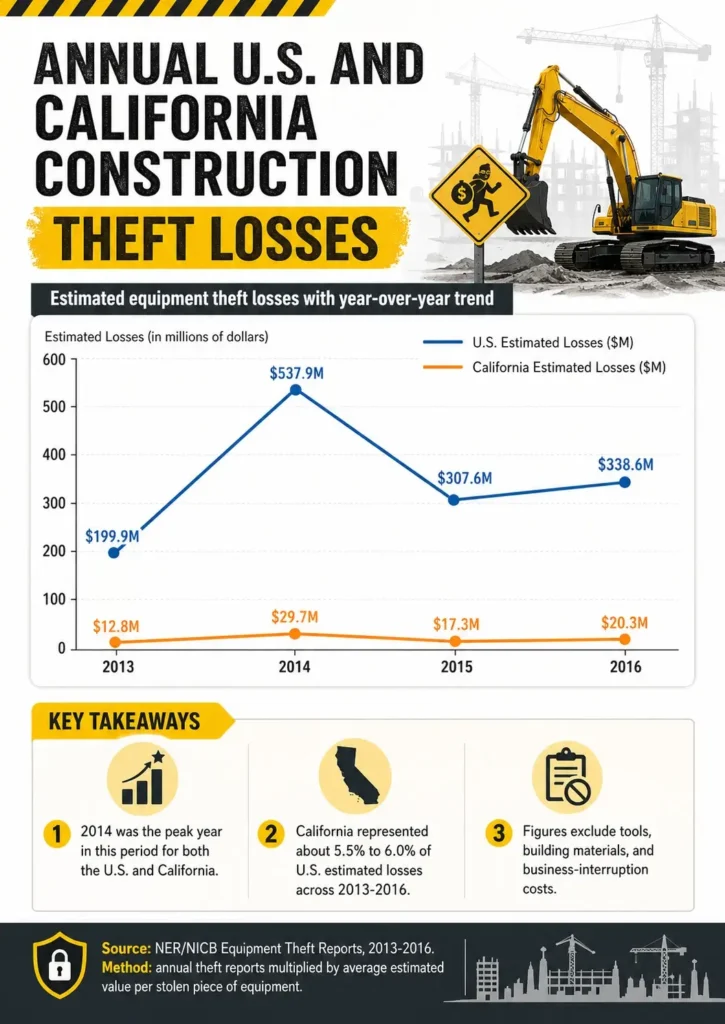
Construction theft losses in the United States are widely cited at $300 million to $1 billion annually, based on insurance-reported incidents tracked by the National Insurance Crime Bureau. The National Equipment Register supports this range but notes that actual losses may run substantially higher due to underreporting.
Underreporting is driven by several operational realities:
- Many stolen items fall below typical insurance deductibles, often $5,000 to $25,000 per claim (IRMI)
- Filing claims can affect future premiums
- Reporting requires time that project teams often cannot spare
This means the headline loss figures generally represent only a portion of total exposure.
Why Construction Is a Persistent Target
Construction sites present a distinct combination of vulnerabilities. Unlike fixed facilities, they are:
- Open and constantly changing
- Staffed by a rotating workforce
- Filled with high-value, easily movable assets
Many machines still use universal keys across manufacturers, a long-documented issue in NICB reporting. Materials like copper and fuel have liquid resale markets, often tied to commodity pricing.
The result is a consistent, predictable target environment for both organized and opportunistic theft.
California by the Numbers: 2026 Construction Theft Statistics
California’s Share of National Construction Theft
California’s construction sector is the largest in the United States by spending volume. The U.S. Census Bureau Construction Spending data tracks total construction put in place across public and private sectors at the national level, with California consistently ranking as the largest state-level market.
With scale comes exposure. NICB state-level reporting consistently places California among the top three states for equipment theft incidents, alongside Texas and Florida.
The combination of high-value urban builds and large rural projects creates a dual-risk environment:
- Dense urban theft of tools and copper
- Remote theft of equipment and fuel
Year-over-Year Trends
Recent industry tracking shows stable but persistent theft levels from 2023 through early 2026, with periodic increases tied to commodity price spikes.
Copper pricing plays a measurable role. CME Group copper futures averaged elevated levels through 2025 compared to historical norms, and theft activity typically rises during these price increases.
CargoNet reporting also highlights significant year-over-year increases in cargo and equipment theft incidents in high-density logistics corridors, including California.
Note on methodology: NICB tracks insured losses, while CargoNet tracks reported incidents across insured and uninsured contexts. These figures are not directly additive and use different methodologies.
The Reporting and Recovery Gap in California
The recovery rate for stolen construction equipment remains low. Industry tracking by the National Equipment Register generally reports that only 20% to 25% of stolen equipment is recovered nationwide (as of Q1 2026).
Key reasons include:
- Lack of GPS or tracking devices on most assets
- Quick resale through online marketplaces
- Equipment dismantling for parts within hours
In California, recovery challenges can increase in regions with cross-border resale channels and dense secondary markets.
The Most Stolen Items from California Construction Sites
| Item Category | Typical Loss per Incident | Resale Speed | Recovery Rate |
|---|---|---|---|
| Heavy equipment (skid steers, mini excavators, backhoes) | $25,000–$80,000 | Hours to days | ~20%–25% |
| Power tools & cordless kits | $5,000–$25,000 | Hours | Very low |
| Copper wire, pipe & metals | Varies (commodity-priced) | Same-day at scrap yards | Very low |
| Lumber, appliances & finished materials | The Most Stolen Items from California Construction Sites,000–The Most Stolen Items from California Construction Sites5,000+ | Days to weeks | Low |
| Catalytic converters & vehicle components | $500–$3,500 per unit | Same-day | Very low |
| Fuel & portable generators | $500–The Most Stolen Items from California Construction Sites0,000 | Immediate (fuel) / hours | Very low |
Heavy Equipment and Machinery
Skid steers, mini excavators, and backhoes are among the most frequently stolen machines. Compact equipment accounts for a significant portion of theft incidents due to ease of transport.
Typical incident value generally ranges from $25,000 to $80,000 per machine. Universal keys and lack of immobilization systems make these assets vulnerable.
Tools and Power Tools
Cordless tool kits from major brands are highly targeted. A single incident can involve $5,000 to $25,000 in tools, based on industry loss reports tracked by the Insurance Information Institute.
These items are easily resold through peer-to-peer platforms with minimal traceability.
Copper Wire, Pipe, and Other Metals
Copper theft remains one of the most persistent risks. Elevated CME copper futures pricing through 2025 has maintained strong financial incentives for theft.
California infrastructure projects and utility work create high exposure, particularly during early-stage rough-in phases.
Lumber, Appliances, and Finished Materials
Lumber theft surged during the 2020 to 2022 price spike, when CME lumber futures reached historic highs. Appliances and finish materials are typically stolen near project completion, when they are installed but not yet secured.
Catalytic Converters and Vehicle Components
California has consistently ranked among the top states nationally for catalytic converter theft, according to NICB reporting. Construction fleets are frequent targets due to predictable parking patterns.
For related patterns, see our analysis of catalytic converter theft in the Bay Area.
Fuel and Generators
Fuel theft and generator theft are common on infrastructure and roadwork sites. Portable generators can be removed in minutes, while fuel is siphoned overnight.
Where It Happens: California’s Construction Theft Hotspots
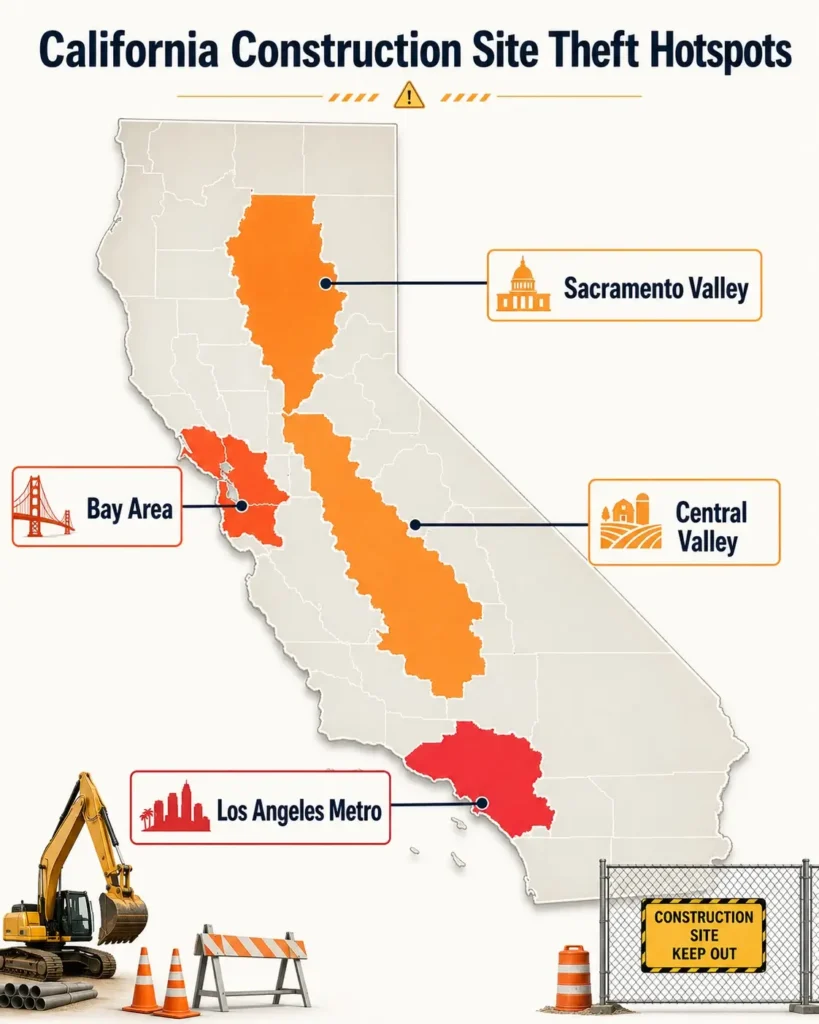
Bay Area and Greater San Francisco
The Bay Area combines dense urban construction with limited site boundaries. Theft patterns focus on tools and copper, particularly on multifamily and mixed-use developments.
Operational note: tight sites typically require vertical surveillance coverage. See our San Francisco surveillance trailer rentals for site-specific configurations.
Sacramento and the Sacramento Valley
Suburban expansion and public infrastructure projects create large, open sites. Equipment and copper theft are common.
See Sacramento surveillance trailer rentals.
Central Valley (Stockton, Fresno, Modesto)
Large logistics and agricultural projects expose remote sites to theft. Copper and heavy equipment are primary targets.
See Stockton surveillance trailer rentals.
Greater Los Angeles and the Inland Empire
High construction volume drives theft across all categories, from cabinetry to machinery. See our Los Angeles surveillance trailer rentals for site-specific configurations.
San Diego and the Border Region
Cross-border resale markets can reduce recovery likelihood. Federal and biotech projects face targeted theft. See our San Diego surveillance trailer rentals for border-region deployments.
When It Happens: Time-of-Day and Seasonal Patterns
Overnight and Weekend Risk Windows
Most construction theft happens between 10 PM and 4 AM, with weekend overnight hours the highest-risk window. Industry security reporting consistently identifies this period as peak theft time. These windows provide maximum time before discovery and minimal on-site presence.
Seasonal Spikes (Holidays, Long Weekends, End-of-Project)
Theft typically spikes during:
- Thanksgiving and Christmas shutdowns
- Long weekends
- Final project phases when materials accumulate
Commodity price increases also correlate with higher theft frequency.
Why California Construction Sites Are Targeted
Commodity Prices and Resale Markets
Metal and fuel prices directly influence theft activity. Higher copper prices generally increase theft attempts due to immediate resale value.
Project Density and Site Concentration
California’s construction volume creates a target-rich environment. Multiple sites within a small radius can allow thieves to hit several locations in one night.
The Insider Threat
Industry security reporting from organizations including ASIS International generally indicates that a meaningful share of construction theft incidents involve current or former employees, with estimates often cited in the 25% to 40% range.
This highlights the importance of internal controls alongside perimeter security.
The Insurance Cost of Construction Theft
Average Claim Size and Frequency
Builders risk claims related to theft generally average $10,000 to $30,000 per incident, based on Insurance Information Institute industry data.
Deductibles, Coverage Gaps, and What Builders Risk Does Not Cover
Typical deductibles range from $5,000 to $25,000, meaning many losses are absorbed directly by contractors (IRMI).
Employee theft often requires separate coverage and may not be included in standard builders risk policies.
The Underwriting Trend in 2026
Insurers are tightening requirements in high-risk regions like California. Active surveillance and documented security plans are increasingly required for favorable terms.
A Layered Prevention Framework: Deter, Detect, Respond, Recover
Layer 1: Deterrence (Lighting, Signage, Visible Surveillance)
Visible security measures generally reduce opportunistic theft. Lighting and signage signal active monitoring.
Layer 2: Detection (Cameras, Sensors, Analytics)
Modern systems include motion analytics and thermal detection for low-light environments.
Layer 3: Response (Voice-Down, Live Monitoring, Dispatch)
Live voice-down interventions through 24/7 remote monitoring often resolve incidents before theft occurs.
Layer 4: Recovery (Documentation, GPS, Marking, Recovery Networks)
Tracking and documentation increase recovery probability and support insurance claims.
Send your project list and current security posture. Hawk returns a written assessment mapped to the four prevention layers within two business days.
Where Mobile Surveillance Trailers Fit
Mobile trailers combine deterrence, detection, and response in a single deployable unit. See our mobile surveillance trailer rental overview for deployment details.
Configuration options include:
- Solar surveillance trailer, for off-grid sites with full sun exposure
- Compact urban surveillance trailer, for tight infill jobsites with limited footprint
- Heavy-duty industrial trailer, for long-duration infrastructure and logistics projects
Send us your jobsite details. Hawk will recommend a configuration sized to your project, your exposure, and your budget.
Prevention ROI: What a Theft-Free Quarter Is Worth
For an illustrative example, consider a contractor operating five sites who experiences two theft incidents per quarter at roughly $18,000 each. That works out to $36,000 per quarter or $144,000 annually in direct losses, before factoring deductibles, schedule disruption, and insurance impact.
Surveillance solutions across multiple sites can often pay back within months rather than years when measured against avoided loss frequency. See our breakdown of surveillance trailer rental cost in Northern California for typical deployment economics.
Actual ROI varies by site exposure, project duration, and current loss history.
Frequently Asked Questions
What is the most stolen item from construction sites?
Power tools and small equipment are the most stolen items from construction sites because they’re portable, valuable, and easy to resell. Cordless tool kits and compact machinery account for the largest share of theft incidents and are often sold within hours through online marketplaces.
How much do construction sites lose to theft each year in California?
California construction theft losses are part of a national total estimated at $300 million to $1 billion per year. California consistently ranks in the top three states in NICB reporting, so its share is significant. Actual losses are likely higher because of underreporting.
Which state has the highest construction site theft rate?
California consistently ranks among the top states for construction site theft, alongside Texas and Florida, according to NICB state-level reporting. High construction volume and dense urban development drive its ranking.
Why is copper wire theft so common on California construction sites?
Copper wire theft is common on California construction sites because copper prices remain elevated and the metal is easy to remove and resell. CME futures data shows sustained demand, and California infrastructure and utility projects offer high exposure during rough-in phases.
How often is stolen construction equipment recovered?
Only about 20% to 25% of stolen construction equipment is recovered nationwide, based on industry tracking by the National Equipment Register. Lack of GPS or tracking devices and rapid resale through online marketplaces and dismantling for parts reduce recovery rates.
What time of day does most construction site theft happen?
Most construction site theft happens between 10 PM and 4 AM, with weekend overnight hours the highest-risk window. Industry security reporting consistently identifies this period as peak theft time because oversight is minimal and detection is delayed.
Are construction site thefts often inside jobs?
Yes. Industry security reporting indicates that 25% to 40% of construction theft incidents involve current or former employees. Insider knowledge of site layout, schedules, and asset locations, combined with reduced suspicion, contributes to this risk.
How can I prove a theft happened on my construction site for insurance?
To prove construction site theft for insurance, document the loss with video evidence, inventory records, and a police report. Insurers generally require this documentation to validate claims, especially when deductibles apply.
What is the best way to prevent theft on a construction site?
The best way to prevent construction site theft is a layered approach combining deterrence, detection, response, and recovery. Each layer addresses a different risk vector and reduces overall exposure compared with relying on any single security measure.
Does video surveillance reduce construction site theft?
Yes. Video surveillance reduces construction site theft. Visible cameras and live remote monitoring generally lower theft attempts and improve response time. Industry data shows actively monitored sites experience fewer theft incidents than unmonitored ones.
Key Takeaways
- Construction theft costs an estimated $300 million to $1 billion annually in the US
- California consistently ranks among the top states for construction theft incidents
- Tools, copper, and equipment are the primary targets
- Recovery rates generally remain below 25%
- Theft typically peaks overnight and on weekends
- Insider involvement is a significant factor
- A four-layer prevention framework (deter, detect, respond, recover) reduces risk
- Mobile surveillance trailers integrate multiple layers in one deployable unit
- Prevention investments often pay back within months, not years
Sources & References
- National Insurance Crime Bureau (NICB). Equipment theft and recovery reporting
- National Equipment Register (NER). Construction equipment theft tracking
- Insurance Information Institute (III). Builders risk and theft claim data
- International Risk Management Institute (IRMI). Deductible and coverage benchmarks
- U.S. Census Bureau Construction Spending. State-level construction volume
- CME Group Copper Futures. Commodity pricing context for copper theft
- CME Group Lumber Futures. Lumber pricing context
- CargoNet. Cargo and equipment theft incident data
- ASIS International. Security industry reporting on insider threat
Data is current as of Q1 2026. Construction theft data is consistently underreported and varies by source methodology.
Get a Free Site Security Assessment from Hawk Surveillance
Construction theft is predictable, measurable, and largely preventable with the right approach.
Send your project list and current security posture. Hawk returns a written assessment mapped to the four prevention layers within two business days. No cost. No pressure.